GIS Day Celebration Fall 2020
Despite the pandemic, we still want to invite you to join us online as we celebrate 2020 GIS Day on Wednesday, November 18. Our GIS Day celebration this year will provide a workshop showing how GIS can be used in research and teaching, showcasing historical maps and ArcGIS Online.
Attendees will have the opportunity to explore some of our favorite mapping collections, work with historical maps, learn how to make maps in ArcGIS Online and find out about more GIS resources at BC. The event is open to the public. Anyone with an interest in GIS is welcome and encouraged to attend. Scroll down for a registration link.
I spoke with Allison Xu, Data & Visualization Librarian, about her recent work organizing GIS Day and the history of the event.
Is there a particular digital project whose use of GIS really stands out?
I really like the digital project Paying for Livelihood. It’s the winner of last year’s contest and a top notch GIS project. It not only demonstrates a good use of ArcGIS Story Map (an online GIS tool) and a very effective presentation of data, but also tells a very good story about so many people suffering from the lack of access to lifesaving drugs.

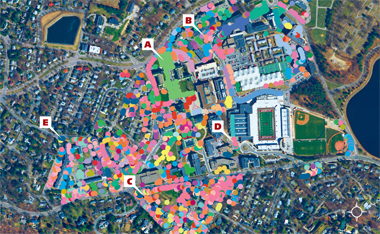
Looking through our records, it appears that the earliest GIS winner is from 2010: The Boston College Tree Inventory – which is still speaking to patterns on campus today. Are there many more students/scholars and classrooms using the technology today?
From my personal instructional experiences, there are many students from Nursing who are introduced to GIS technology in the classroom; faculty are interested in introducing GIS basics and various GIS tools to students. I know Adam Williams is also teaching GIS to Social Work students.
Many GIS projects seem to focus on environmental changes in a given area. Has GIS technology been used in assisting with COVID data or presenting COVID information?
There are many GIS projects that are designed and used by public health professionals and authorities in responding to the epidemic. The Johns Hopkins COVID-19 Dashboard is a great mapping example, which has been widely used to communicate about the pandemic to the public.
The workshop will be presented by Awanti Acharya, Geographic Information Systems Consultant (Research Services) and Matt Naglak, Digital Scholarship Librarian (O’Neill Library).
Visit our website for more information about GIS day.